

There’s two truths as a consumer looking for real estate in Australia:
- The big real estate websites like Realestate.com.au and Domain.com.au are in the business of providing almost enough information for consumers to be able to have the advantage. Hidden prices, “only up 🚀” articles, and pumping the industry is part of what they do – in a way it makes sense, they make their money from industry, the consumer is the product.
Obfuscated data is a key part of increased competition, rather than providing the right tools for transparency and decision making this heightens fear. - Australian media continues to ensure confusion. At any point in time, you will find conflicting statements and as such that it is hard to find out what is actually happening in the market place. That is the logical outworking of a free press, so while this is okay, it means it is still difficult to sift.
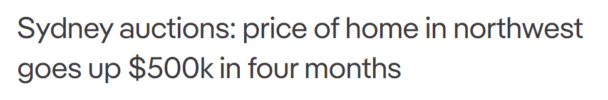
Overly generic headlines and articles like ‘rents/prices are up 25%’ are unhelpful, and of course serve to create drama (and therefore clicks) where actually in an individual’s case – it may be far from reality. But that fear sticks and drives behaviour regardless.
With all of this it feels like there are hardly any tools to help make well thought through decisions.
Until recently I did what everyone else was doing. I just thought I’d have to pay for help, or be at the whim of agents who I both didn’t know, and more generically didn’t trust.
Until I found out that you can download data from the NSW Government on house pricing and rental data.
So in comes my data driven thinking, and immediately I see opportunities to get my own insights.
The problem though, the NSW housing data isn’t in an easy to use format.
You have to download hundreds of files for just one week of sales. Thousands if you want a longer term view of what’s going on.
Sydney house price data visualisation dashboard
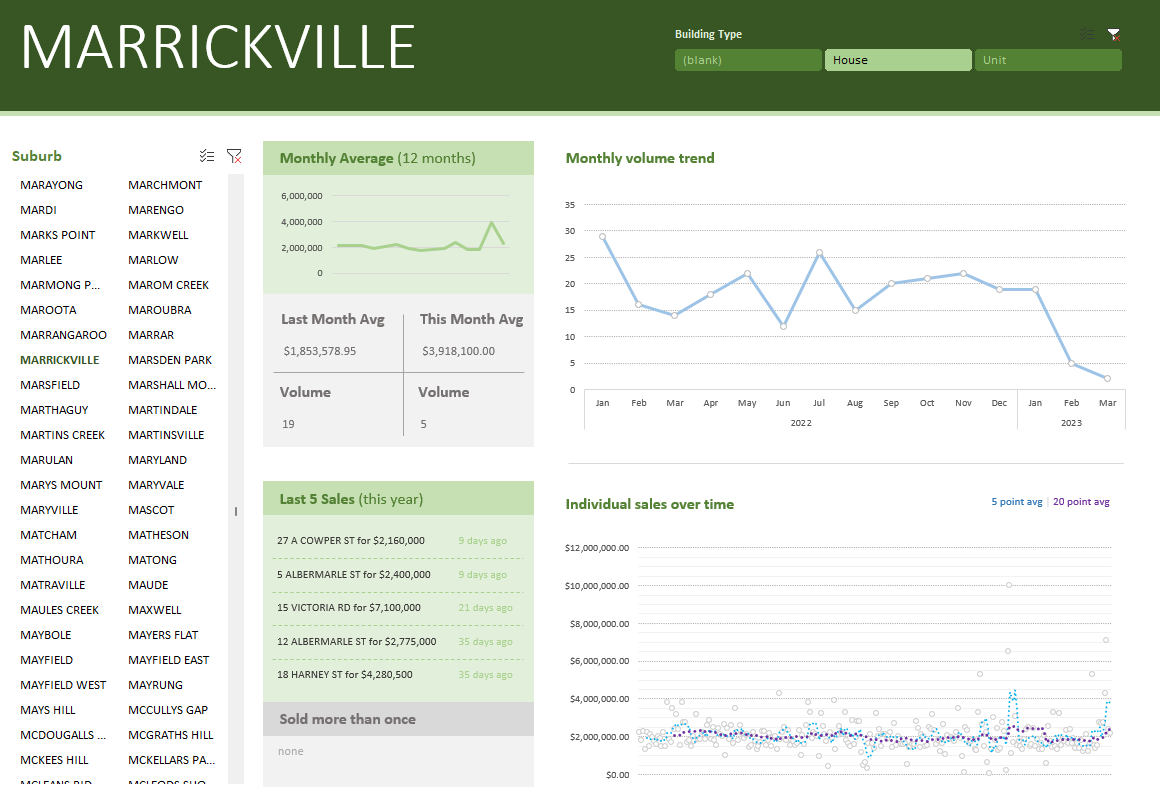
A year’s worth of data is around 5,000 files (I’m currently up to around 8,000) combined into a neat little Excel dashboard that can be updated each Monday morning when NSW Valuer General data is updated.
With data updated, I can now:
- See prices for sales even if they’re hidden on real estate websites.
- Watch trends over time without having to ‘feel’ the trend or rely upon external media.
- Dive in to see properties that have sold multiple times – and compare prices over time.
- Research individual streets, and house price data quickly – rather than trying to navigate real estate websites.